Component Tracking is Here
As a web/product industry, we’ve reshaped our teams, processes, and even tools (Figma, Vue, React, etc.) around components and design systems because we believe they are the magical keys to building products at scale — making us highly organized and efficient so that we can focus our time and talents on innovation.
But for all of these wonderful things to be true, must first ship!
Most of us still find ourselves in the miry process of getting our components out into live products. We’ve traded redrawing and recoding the same rectangles on a page-by-page basis to spending countless hours auditing pages, creating tickets, and trying for the third, fourth, or fifth time to ship our components.
Without automatic, objective insights into how our components manifest and impact our products, component adoption is nearly impossible to achieve.
Start tracking in Luro now

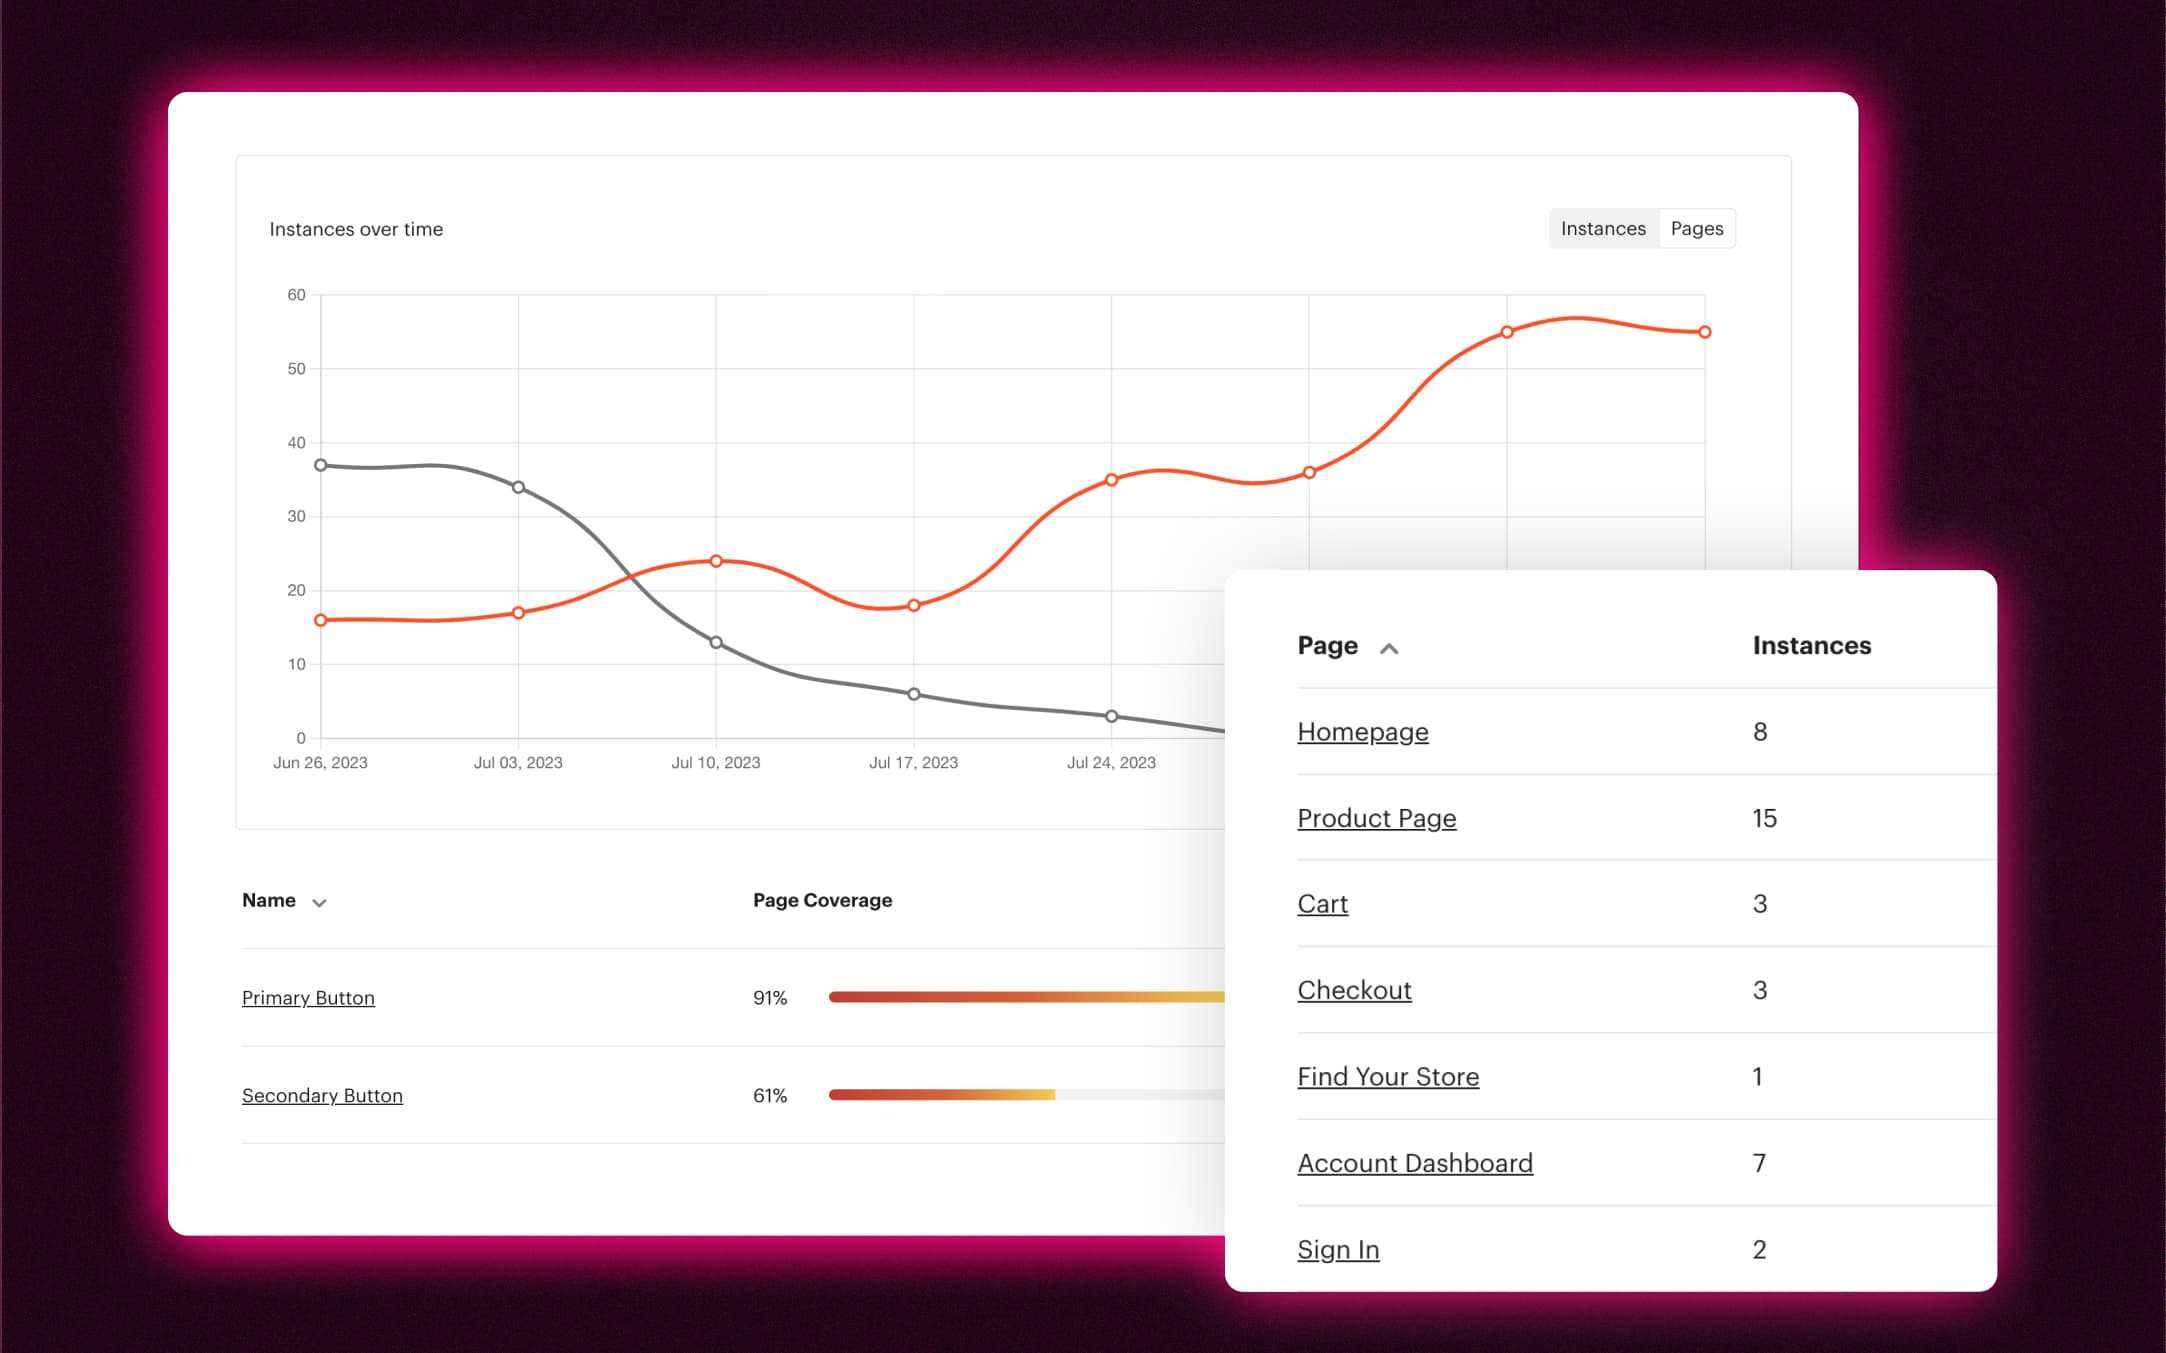
I’m happy to announce that Luro can help you with these insights today. For any component you’ve added to Luro, you can track that component on your live product. Luro gives you charts and graphs to track the following:
- View component adoption over time
- Get a page-by-page breakdown of component usage
- Track and depreciate outdated and legacy components
- Manage the rollout of your design system
- Start auditing and organizing existing components
Luro makes the work of component adoption automatic, objective, and seamless. These insights also help demonstrate the ROI for design system and product team work, ensuring that optimized components make their way to users and customers.
Join us
Sign up for free and take component tracking for a spin yourself. Have questions, feedback, or want to chime in on future Luro features and functionality? Join us on Discord!
